Multi-Location Medical Practice Dashboard: How to Compare Digital Performance Across Locations
If you run a medical group with more than one location, you've probably had this exact conversation: corporate asks why overall patient inquiries are flat, the regional number looks fine, and nobody can say which of your eight clinics is actually underperforming. That's not a reporting gap — it's a structural problem with how most multi-location healthcare dashboards are built. Industry research from Birdeye's 2026 State of Google Business Profile report found that roughly 27% of multi-location operators say they cannot reliably compare performance across their own locations. If you're in that group, the issue usually isn't a lack of data. It's that the data is aggregated in ways that hide what you need to see.
This post covers what a multi-location medical practice dashboard needs to do well: report at the individual location level and as a roll-up, apply fair comparisons across clinics that aren't actually alike, and restrict access by role so the right people see the right data — nothing more, nothing less.
What a Multi-Location Medical Practice Dashboard Actually Needs to Do
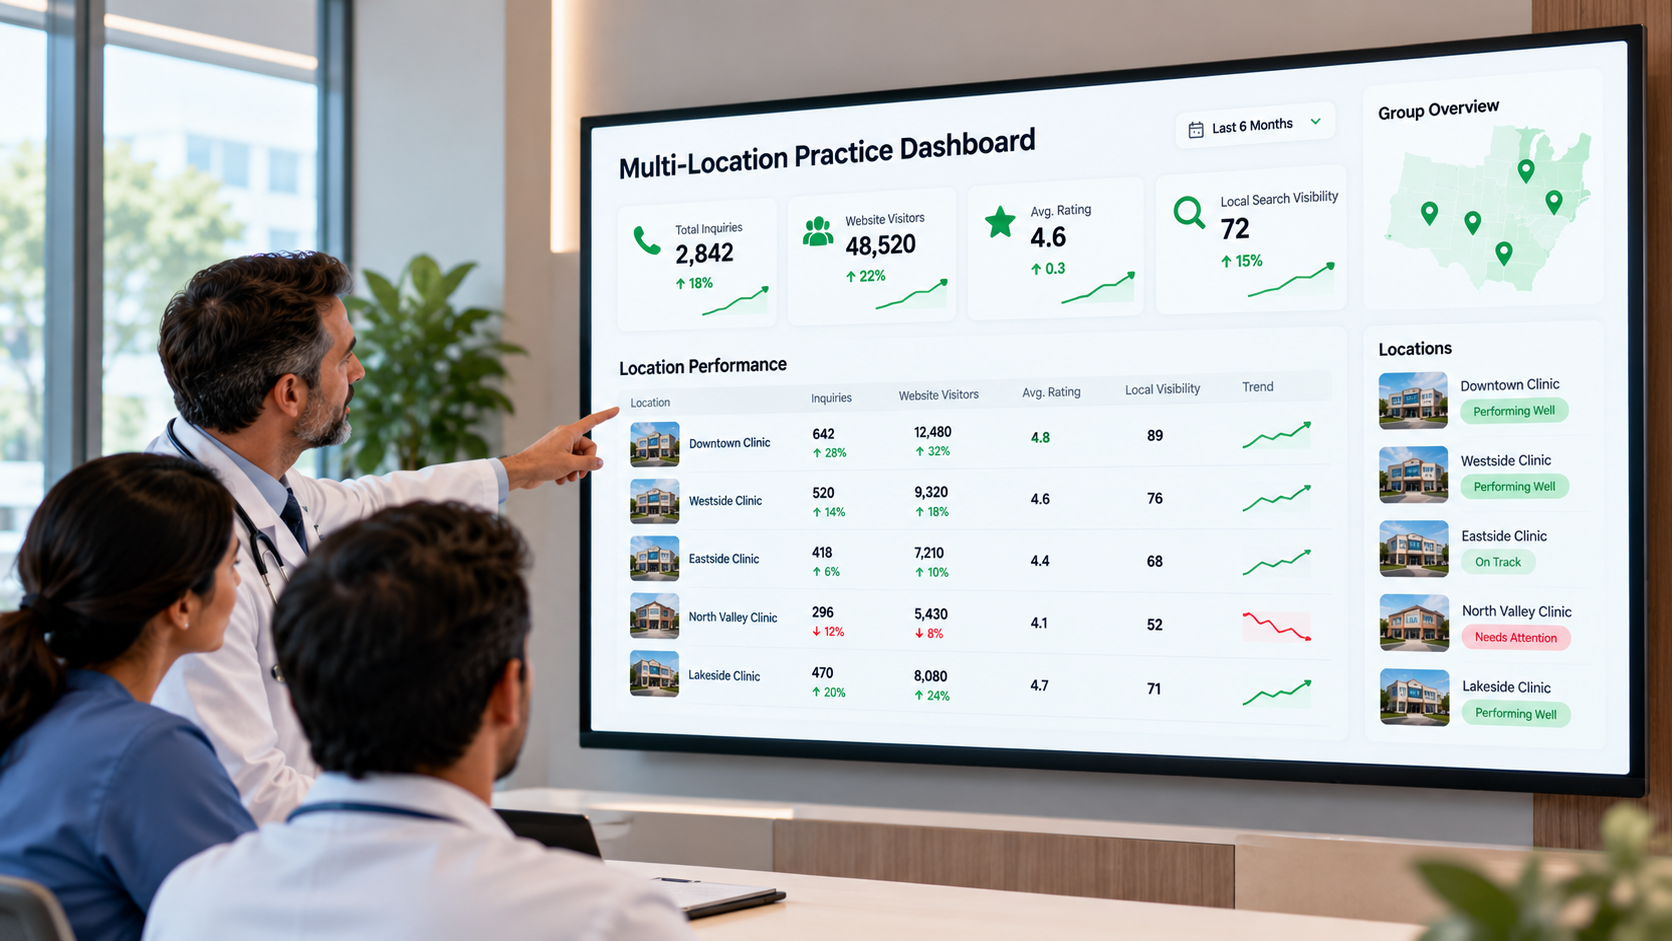
A multi-location medical practice dashboard pulls digital performance data — Google Business Profile activity, review volume and ratings, website traffic, local search visibility, and increasingly how a practice appears in AI assistant answers — from every clinic location into one reporting layer. The goal is to let a regional manager or marketing director see both the forest and the trees: total patient-facing engagement across the group, and how each individual site contributes to it.
That sounds simple, but a genuinely useful clinic digital performance dashboard has to solve two problems most spreadsheet-based reporting never addresses: aggregation that hides outliers, and access that isn't scoped to the person looking at it. We'll take those one at a time.
The Roll-Up Masking Problem
When you average or sum metrics across locations, strong performers can quietly absorb the damage done by weak ones. A group of ten clinics where two locations are getting excellent call volume and local visibility can post a healthy regional total even if five locations have stagnant or declining numbers. This is sometimes called the "rollup masking problem," and it's a well-documented failure mode in multi-location reporting generally, not just in healthcare — the same pattern shows up in retail and franchise analytics wherever one region's performance is blended into a single number.
For a medical group, the stakes are higher than a vanity metric. A clinic with quietly declining Google Business Profile engagement, slipping review ratings, or vanishing local pack visibility is often an early signal of a real operational issue: a provider departure, a staffing gap affecting response times, or a competitor opening nearby. If the roll-up hides that signal for two or three quarters, you lose the lead time to act on it.
The fix isn't complicated in concept, even if it takes real reporting infrastructure to execute: every multi-location medical practice digital performance dashboard should present location-level detail as the primary view, with the group-wide roll-up as a secondary summary layer — not the other way around. If your current reporting only shows you the regional average with locations buried three clicks deep, that's worth flagging before you invest further in it.
What "Fair Comparison" Actually Means
Even once you're looking at individual locations side by side, raw numbers can mislead you if you don't adjust for context. A single-provider dermatology clinic in a suburb of 20,000 people is never going to generate the same call volume as a ten-provider urgent care in a metro area of 500,000. Comparing them on raw totals isn't benchmarking — it's noise.
A credible medical group location benchmarking dashboard should let you normalize for the factors that actually explain performance differences:
- Market size and population density around each location
- Specialty mix (a primary care clinic and a specialty surgical center have structurally different search and call patterns)
- Provider count at each site, since more providers generally means more listed appointment capacity and search surface area
- Time in market, since a location open 18 months is not comparable to one open eight years
Instead of ranking every location on an absolute scale, better dashboards group locations into comparable cohorts — similar market size, similar specialty — and benchmark within those cohorts. That's the difference between "Location 7 is bad" and "Location 7 is underperforming other single-provider clinics in markets its size," which is a far more actionable finding.
If you're not sure your current audit process even captures the right baseline metrics to make this comparison meaningful, it's worth reviewing what a medical practice online visibility audit should include before you try to layer benchmarking on top of incomplete data.
Core Metrics to Track at the Location Level
Google's own documentation on Business Profile Insights is a reasonable floor for what every location-level view in a medical practice digital marketing KPI dashboard should capture: phone calls initiated from the listing, direction requests, website clicks, and the search queries that surfaced the profile. These are first-party, verifiable metrics rather than estimates, which makes them a sound foundation for cross-location comparison.
Beyond Google Business Profile activity, a well-built location-level view typically includes:
- Review volume and average rating, tracked over time rather than as a single static score
- Review response rate and response time, since unanswered reviews are a visible, controllable gap
- Local pack (map pack) visibility for the location's core service terms — useful context here is that average local 3-pack visibility across typical local businesses generally falls in the 20%–40% range according to industry benchmarking research from WebFX, which gives you a rough sense of what "normal" looks like before you start comparing your own locations against each other
- Website traffic and conversion actions (appointment requests, form fills, click-to-call) attributable to each location's page or listing
- Presence and accuracy across directories and, increasingly, how the location is represented in AI-generated answers, since patients are starting to research providers through AI assistants as well as traditional search
None of these numbers mean much in isolation. Their value comes from being tracked consistently over time, at the location level, so trends — not single snapshots — drive decisions.
Permissions: Why Access Control Isn't Optional
This is the part of multi-location dashboard design that gets the least attention and causes the most friction. A group with 15 locations typically has at least three distinct audiences who need different views of the same data:
- Corporate or regional leadership, who need the full roll-up and the ability to drill into any location
- Location managers or office managers, who need their own site's detail but shouldn't necessarily see competitive performance data from sister locations
- External agencies or consultants, who may need access to specific locations they manage, without visibility into the rest of the group's internal reporting
This is a role-based access control (RBAC) problem, and it's worth treating it as one rather than bolting on ad hoc permissions later. RBAC assigns access based on a user's role rather than granting blanket access and hoping people don't look where they shouldn't — a structure that's well established in healthcare IT generally. It also connects to a real compliance principle: the HIPAA Security Rule's access control standard is built around the "minimum necessary" idea, meaning staff should generally only be able to see the information required for their specific job function. While digital performance metrics like call volume or review counts aren't themselves protected health information, many multi-location dashboards sit in the same operational environment as scheduling and patient communication tools, so building access control around clear roles from the start is good practice rather than an afterthought.
If you're managing locations through an external marketing partner, this is also where a white label digital presence audit for doctors becomes relevant — agencies managing multiple practice clients often need a reporting layer that can be scoped per client, with results presented under the practice's own branding rather than the agency's, without exposing one client's data to another. The reporting demands here are similar enough across agencies that it's worth comparing how different platforms handle it before committing; this guide to reporting tools built for agencies managing medical clients walks through what to look for.
Competitor Visibility Without Overcomplicating It
For groups with locations in multiple markets, competitor reporting for multi-location medical groups adds another layer of useful context — not to obsess over a single rival's ranking, but to understand whether a location's flat numbers reflect a group-wide trend or a local market dynamic. It works best when it's scoped per location (comparing each site to the two or three practices it actually competes with locally) rather than applied as one blanket competitive set across the whole group, which tends to produce comparisons that don't map to any real market.
Keep this layer lightweight. The goal is directional context — is this location losing local pack visibility because of something internal, or because a new practice opened two blocks away — not a running leaderboard that becomes a distraction from the operational metrics that actually drive patient contact.
Choosing Software That Handles This Well
Not every medical marketing software for multi-location practices platform is built to handle location-level detail, fair benchmarking, and role-based permissions together. Many tools do one of the three well and treat the others as an afterthought — a dashboard with great visualizations but flat, ungated access for every user, or granular permissions with no real benchmarking logic underneath.
Before evaluating specific vendors, it's worth working through a structured buyer's checklist for medical practice marketing software, since the questions that matter here — does it separate location-level from roll-up reporting by default, does it support role-based views, does it allow cohort-based benchmarking rather than flat rankings — are easy to overlook in a demo that's optimized to look impressive rather than to answer your actual operational questions.
A Practical Starting Checklist
If you're building or evaluating digital performance reporting for multi-location physician groups, a reasonable starting checklist looks like this:
- Confirm the dashboard defaults to location-level detail, with roll-up as a summary, not the reverse.
- Group locations into comparable cohorts (market size, specialty, provider count) before benchmarking them against each other.
- Define at least three access tiers — corporate, location manager, external agency — before rolling the tool out, not after someone raises a concern.
- Track Google Business Profile engagement, review metrics, local pack visibility, and website conversion actions consistently at each location.
- Scope any competitor reporting to each location's actual local market, not the group's full market footprint.
- Revisit your benchmarking cohorts periodically — a location's market size and competitive set change over time.
Getting a clear baseline read on where each location actually stands is the natural first step before any of this reporting structure matters.
Conclusion
A multi-location medical practice dashboard earns its keep when it does two unglamorous things well: it shows you each location honestly, without a strong performer masking a weak one, and it puts the right information in front of the right person without over- or under-sharing. Neither of those is a flashy feature, but both are the difference between a dashboard that drives real operational decisions and one that just produces a tidy quarterly chart nobody acts on.
If you haven't had a straightforward look at how your locations currently show up across Google, reviews, and AI-generated answers, The Doc Mirror offers visibility auditing across those channels as a reasonable starting point before you invest in a full dashboard build-out.
Sources
- Google Business Profile Help — "Understand your Business Profile performance & insights" — https://support.google.com/business/answer/9918094?hl=en
- WebFX — "Google Business Profile Benchmarks: What the Data Shows" (industry commentary) — https://www.webfx.com/blog/seo/google-business-profile-benchmarks/
- Birdeye — "State of Google Business Profile 2026" (industry commentary) — https://birdeye.com/blog/state-of-google-business-profiles/
- Indexed — "Multi Location SEO Reporting: How to Compare Performance Across Locations" (industry commentary) — https://www.joinindexed.com/blog/how-to-compare-seo-performance-across-business-locations
- Paubox — "What is role-based access control?" (industry commentary) — https://www.paubox.com/blog/what-is-role-based-access-control
- Accountable HQ — "Role-Based Access Control (RBAC) in Healthcare" (industry commentary) — https://www.accountablehq.com/post/role-based-access-control-rbac-in-healthcare-benefits-examples-and-best-practices
- Censinet — "HIPAA Access Control Requirements Explained" (industry commentary) — https://censinet.com/perspectives/hipaa-access-control-requirements-explained
- TapClicks — "Multi-Location Marketing Reporting: What You Need to Know" (industry commentary) — https://www.tapclicks.com/blog/multi-location-business-reporting